MyTeamSafe
Dashboard Updates
MyTeamSafe hasn't only updated the Mobile app but has also added new features to the dashboard. Usage report and how to stop a session from the admin dashboard
How to access the usage report
This feature can only be used at Company Level
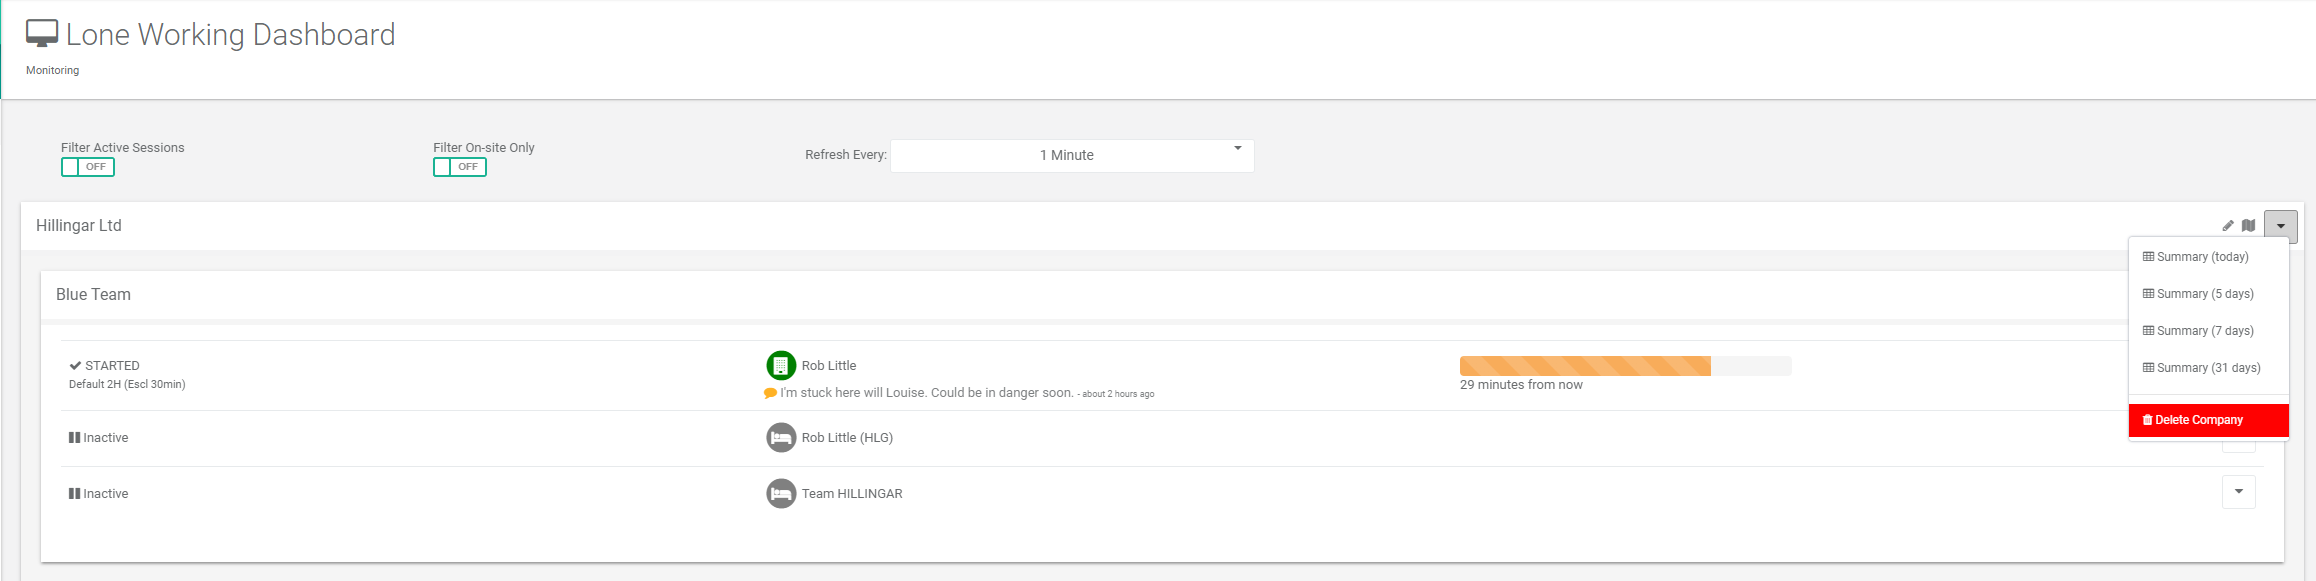
To view the Usage report on the dashboard you will need to be on the main page of the dashboard and go over to the arrow on the far right of your company name and click on the down arrow.
Once you have clicked on the arrow you will see a drop down menu. You will now be shown :
Today
5 days
7 days
31 days.
In this documentation we want to see the last 31 days. This shows you everything thats happened in the company in the past 31 days (month)
Usage Report
You can now view the usage summary of your company this allows you to keep track of the total amount of sessions that have started, also knowing how many sessions that have escalated or started a panic mode and much more.
This screen shot helps you get a better understanding on how it all works. This ussage report is a 31 day summary.
From here you can see that there is
Company summary
Group summary
Users in group Blue Team
Users in group Night Shift
Where it says ‘Name‘ The users email will be shown
(Names have been blocked out for GDPR reasons)
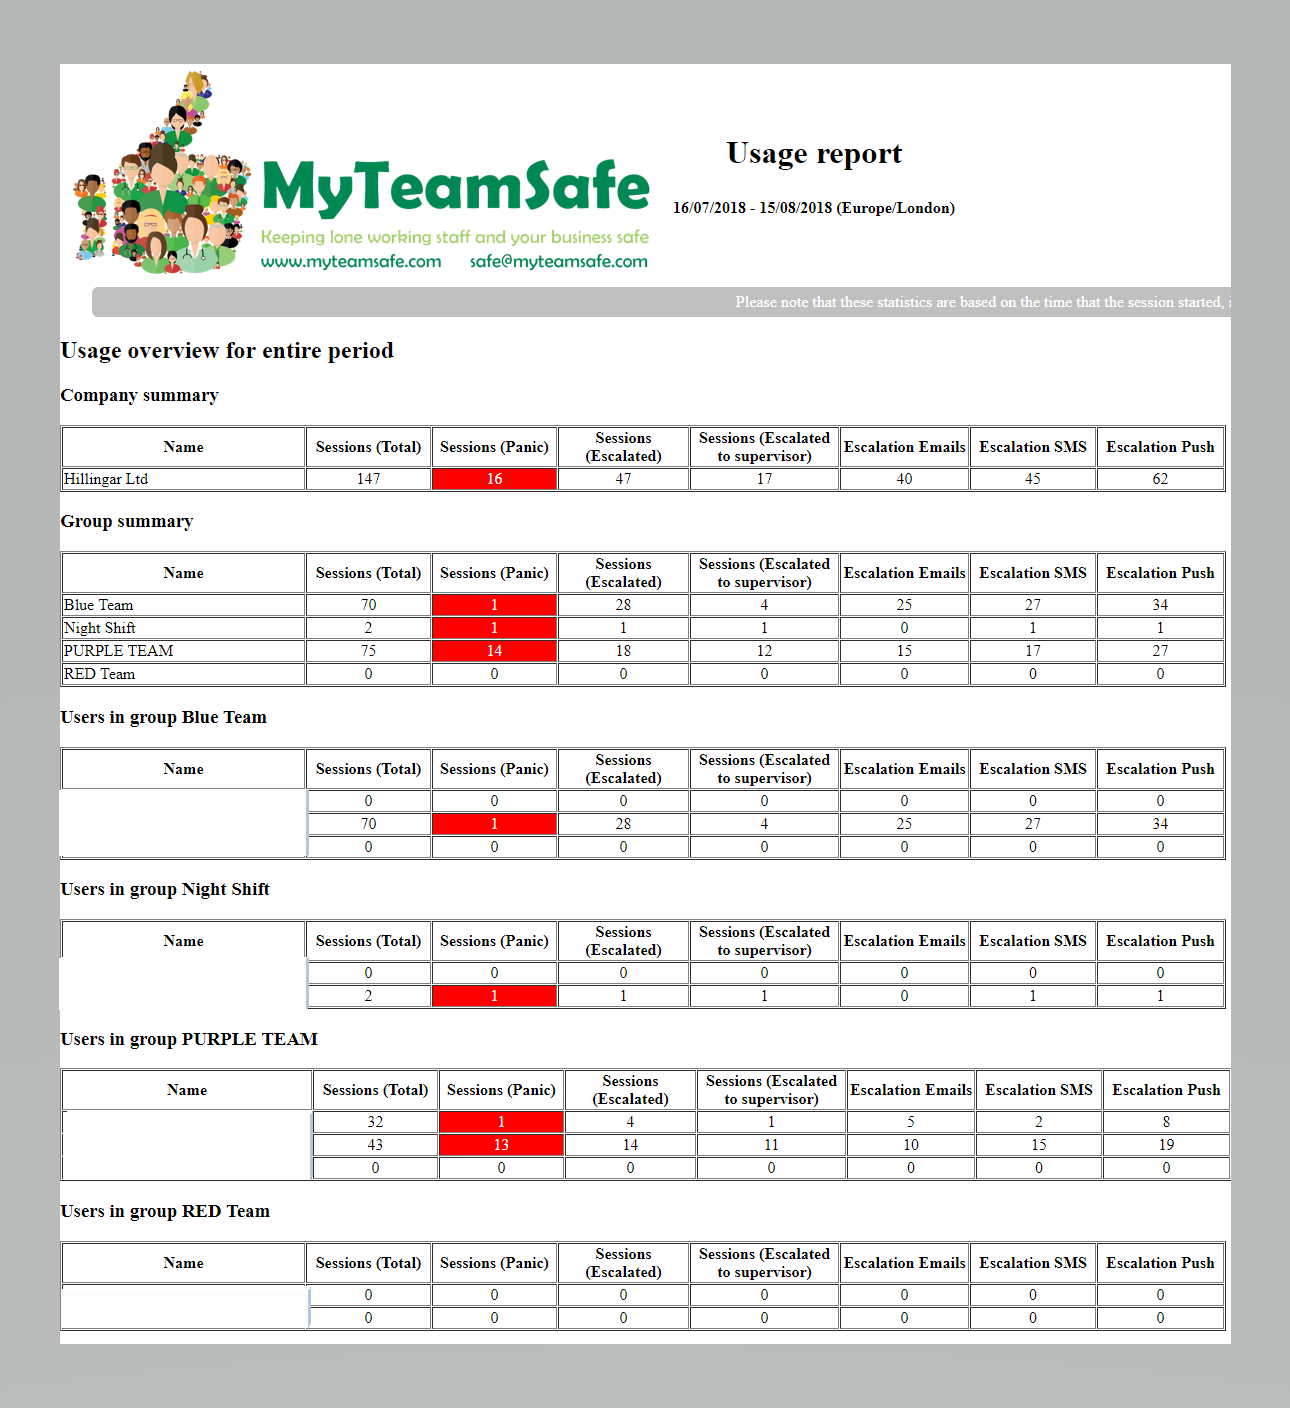
Company Summary
Company summary – This shows you the report summary of everyone in the company using the system. From this screen shot you can see the total amount of
Sessions that have started
Sessions the started a panic
Sessions that escalated
Sessions escalated to supervisor
Escalation emails
Escalation SMS
Escalation Push
This can be very useful and effective to your business.
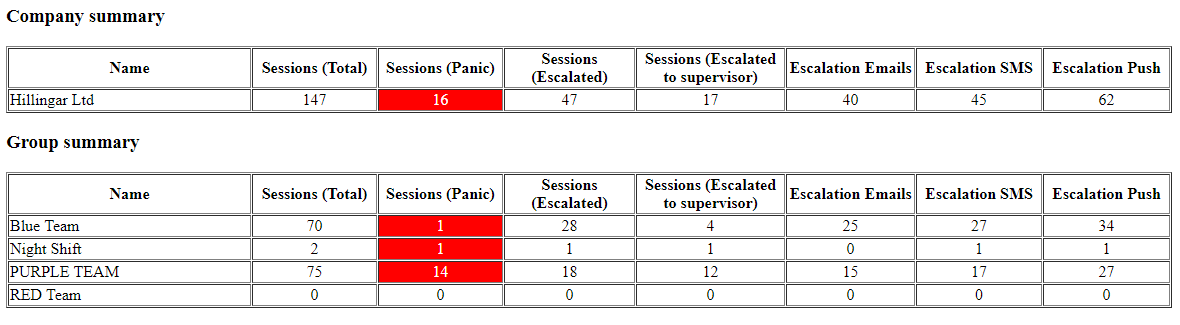
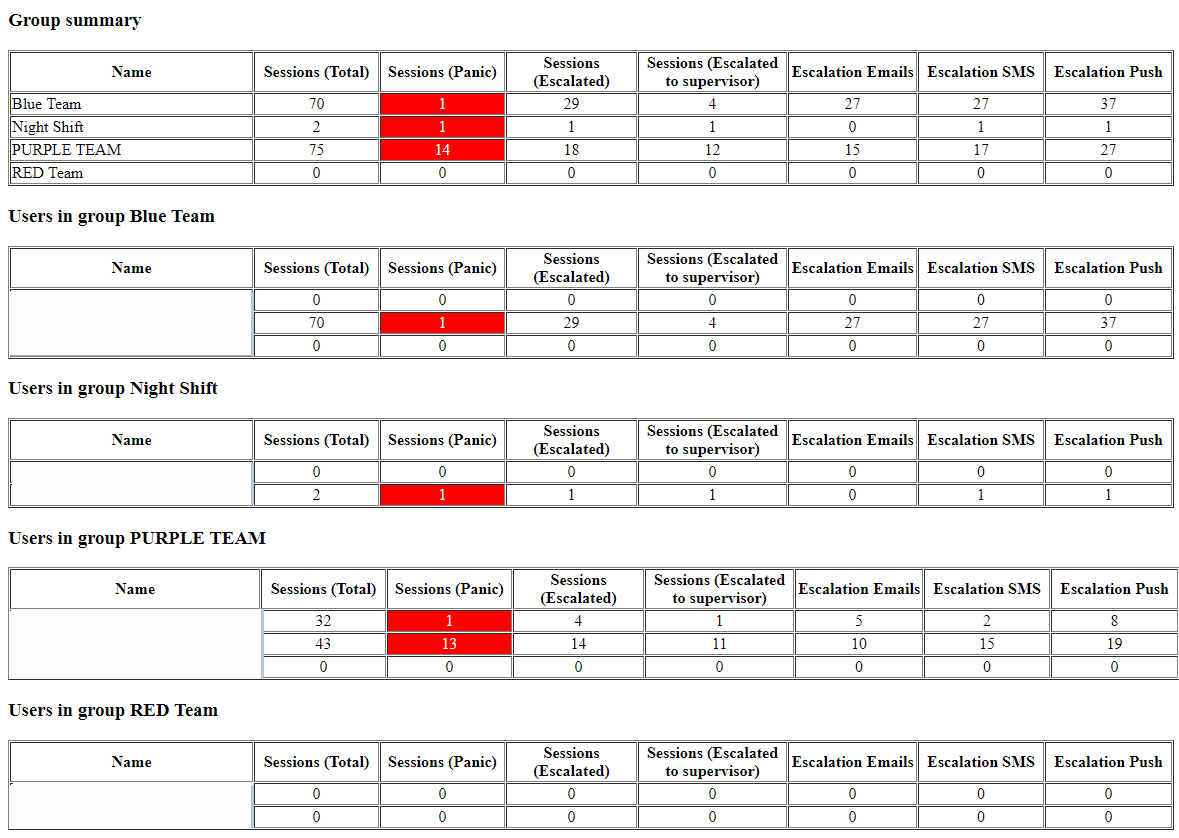
Group Summary
Group summary – This shows you all the groups created within the company. From the screen shot you can see that there are 4 groups in the company :
Blue Team
Night Shift
Purple Team
Red Team
This helps the supervisor check the reports for each group in one place, this can be helpful to see which group is in the most venerable environment.
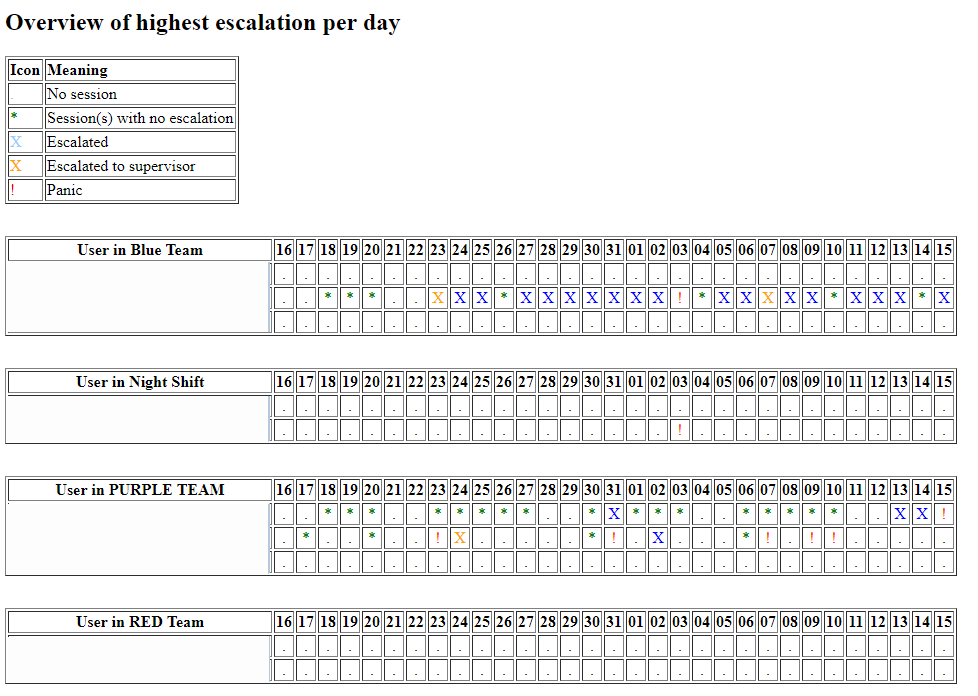
Overview of highest escalation per day
In this screenshot you can see the Over view of the highest escalation per day.
Here you can see the groups in the company
User in blue team
User in night shift
User in purple team
User in red team
The numbers in the diagram above are the days.
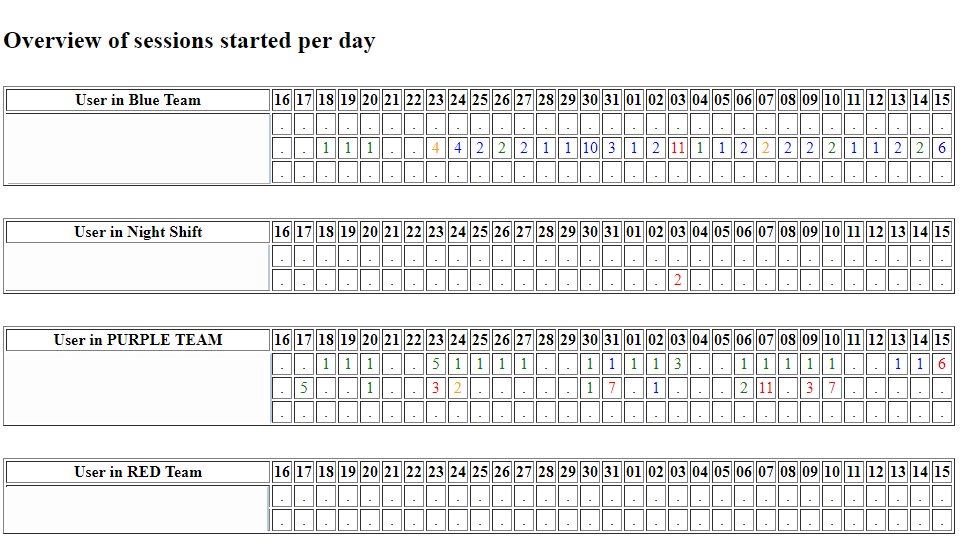
Overview of sessions started per day
This screenshot allows you to see how many sessions your user has started in a day, the color of the number will change if they have
Escalated (Blue)
Escalated to supervisor (orange)
Panic (Red)
If your user has only started a session and hasn’t escalated or started a panic the number will remain green. The number will keep a color with the highest priority. For example if your user started a panic but started 4 sessions in one day the number will remain red for that day.
You can hover over a number with your cursor, this will then show you how many sessions they have started as well as escalations and panics.
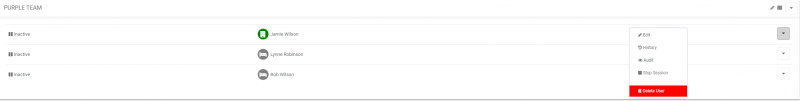
Deleting a user from Admin dashboard
To stop a users session you will need to find their user on the dashboard and click on the arrow on the far right of their name. Once you have clicked on the arrow you will see that you can ‘Stop session’ (this is highlighted in red)
This feature was added to help the supervisor, for example, your user may be on holiday and the session is still running or forgot to stop there lone working session before they went on holiday.